





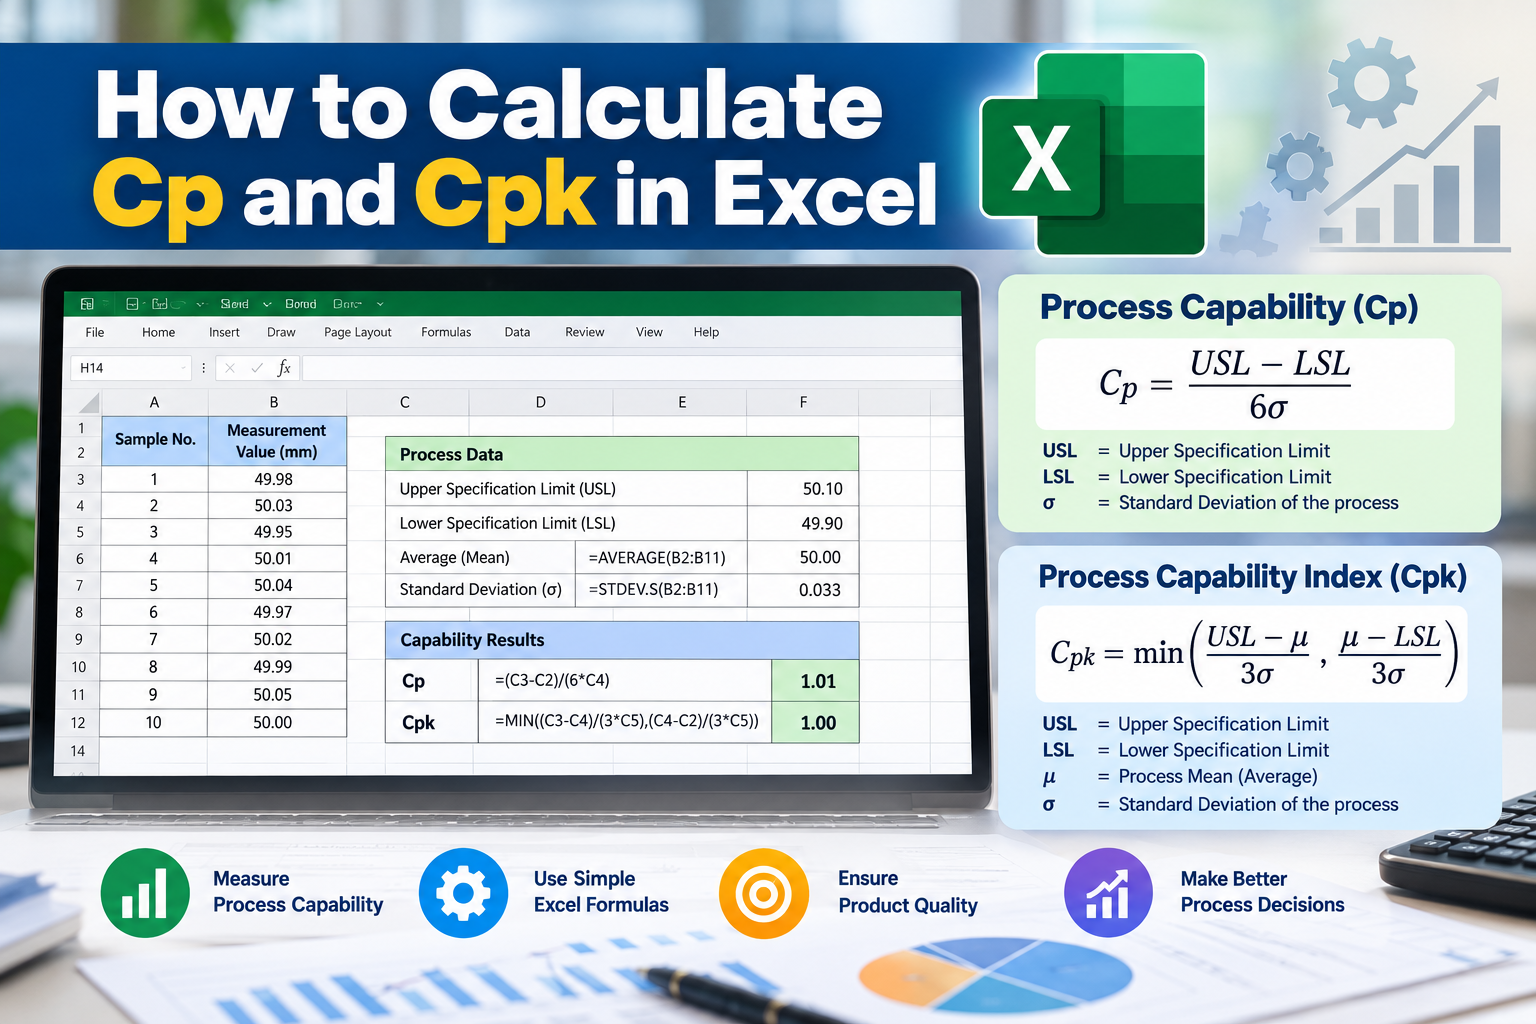

Understanding process capability is crucial for businesses, especially in manufacturing and quality control. By calculating Cp and Cpk, organizations can determine how well their processes meet specifications. In this guide, we will explore how to calculate Cp and Cpk in Excel, making it accessible even for those who may not be well-versed in statistical analysis.
What are Cp and Cpk?
Before diving into the calculations, let’s clarify what Cp and Cpk are:
Understanding Cp
Cp, or Process Capability, measures a process's potential to produce output within specified limits. It is a ratio of the specification range to the process variation. A higher Cp indicates a more capable process. The formula for Cp is:
Cp = (USL - LSL) / (6 * σ)
Where:
Understanding Cpk
Cpk, or Process Capability Index, takes into account the mean of the process and how centered it is within the specification limits. It is a more accurate measure of process performance than Cp. The formula for Cpk is:
Cpk = min[(USL - μ) / (3 * σ), (μ - LSL) / (3 * σ)]
Where:
Why Calculate Cp and Cpk?
Calculating Cp and Cpk allows organizations to:
How to Calculate Cp and Cpk in Excel
Step 1: Gather Your Data
Collect the data you need for the calculation, including:
Step 2: Calculate the Mean and Standard Deviation
To calculate Cp and Cpk in Excel, you first need to find the mean (average) and standard deviation of your data.
Step 3: Input Specification Limits
In separate cells, input your USL and LSL values. For instance:
Step 4: Calculate Cp
Now that you have the mean and standard deviation, you can calculate Cp.
In a new cell, enter the formula:
= (B1 - B2) / (6 * STDEV.P(A1:A10))
Step 5: Calculate Cpk
For Cpk, you need to find the minimum of two calculations: one for the upper limit and one for the lower limit.
In a new cell, enter the formula:
= MIN((B1 - AVERAGE(A1:A10)) / (3 * STDEV.P(A1:A10)), (AVERAGE(A1:A10) - B2) / (3 * STDEV.P(A1:A10)))
Example Calculation
Let’s say you have the following data points in Column A:
And your USL is 20 and LSL is 5. Your calculations would go as follows:
Best Practices for Using Cp and Cpk
To maximize the effectiveness of your Cp and Cpk calculations, consider the following best practices:
FAQs
1. What is a good Cp and Cpk value?
A Cp and Cpk value of 1.33 or higher is generally considered acceptable, indicating that the process is capable of producing within specifications. Values above 2 are often regarded as excellent.
2. Can I calculate Cp and Cpk for non-normal distributions?
While Cp and Cpk are primarily designed for normal distributions, adjustments can be made if the data does not follow a normal distribution. However, alternate methods or indices may be more appropriate.
3. How often should I calculate Cp and Cpk?
It’s advisable to calculate Cp and Cpk regularly, especially after any process changes or quality improvements. Doing so helps maintain process control over time.
Conclusion
Calculating Cp and Cpk in Excel is a straightforward process that can offer valuable insights into your manufacturing processes. By understanding and applying these metrics, organizations can enhance quality control, reduce defects, and improve customer satisfaction.
Are you ready to elevate your quality management practices? Start using Excel today to calculate Cp and Cpk and transform your processes!
Call to Action: If you found this guide helpful, don’t forget to share it with your colleagues! Subscribe for more insights on quality control and effective management practices.