
Latest Post
Quality Management Courses



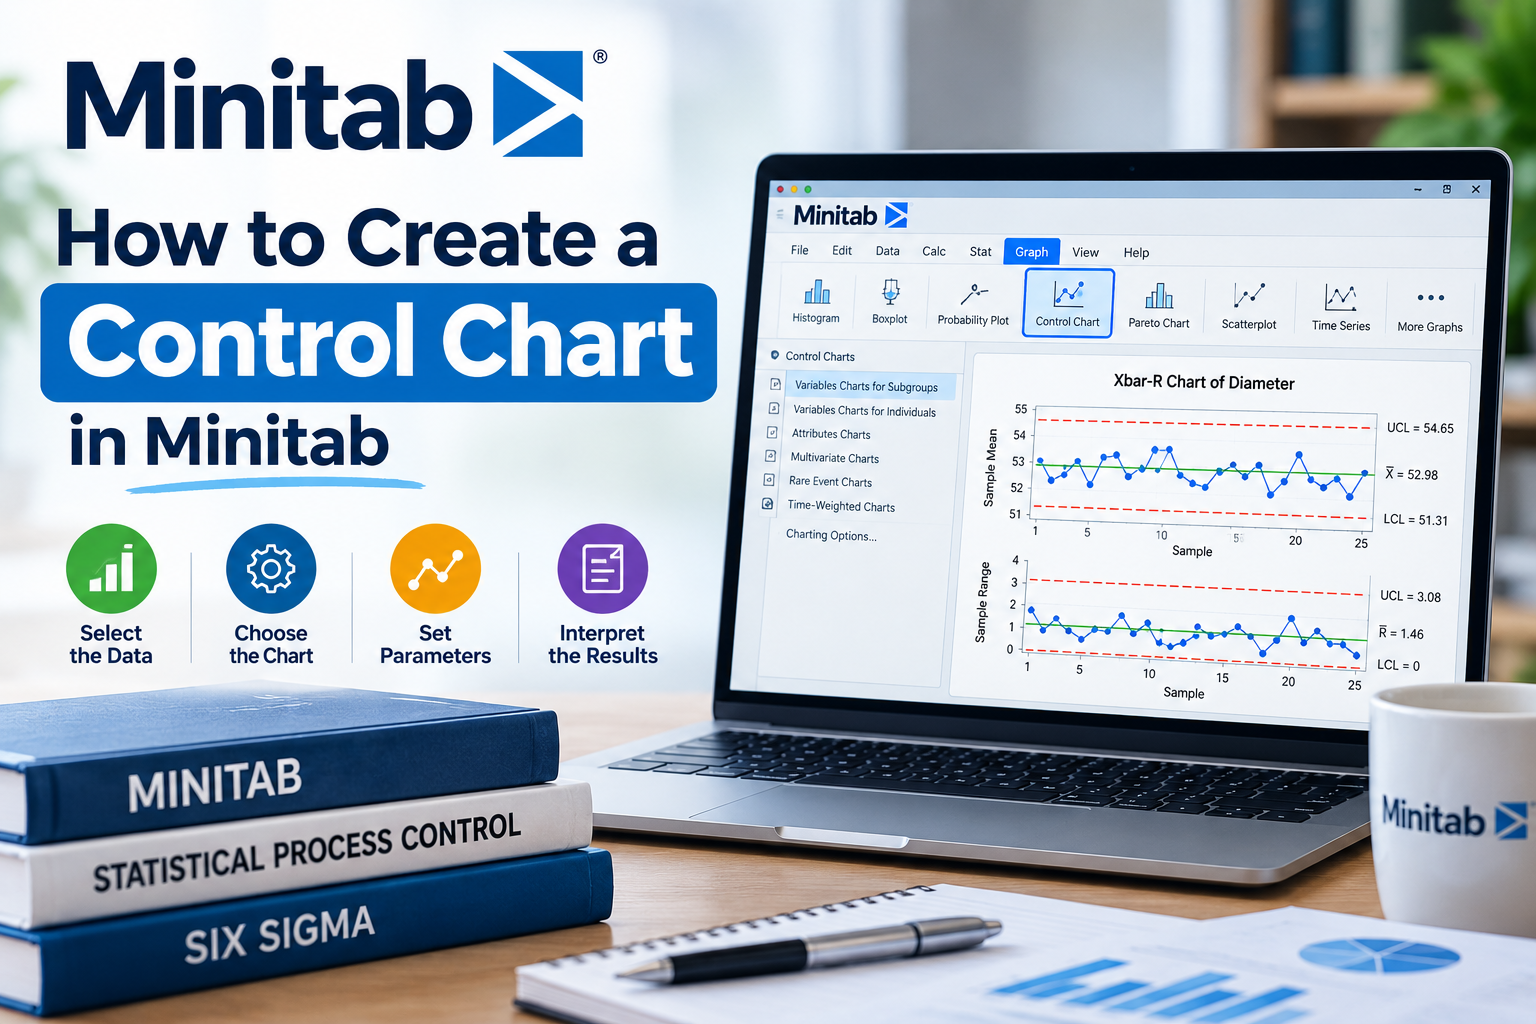

Control charts are essential tools in quality control and continuous improvement processes. They help organizations monitor processes over time and identify any variations that may indicate potential problems. Minitab, a powerful statistical software, simplifies the creation of control charts, making it a popular choice among professionals in India and beyond. In this blog, we’ll explore how to create a control chart in Minitab step-by-step, ensuring that you have a comprehensive understanding of this crucial tool.
What is a Control Chart?
A control chart is a graphical representation used to monitor the stability of a process over time. It helps in distinguishing between common cause variation (natural fluctuations in a process) and special cause variation (unexpected changes). By analyzing control charts, organizations can maintain quality standards and improve their processes efficiently.
Why Use Minitab for Control Charts?
Minitab is widely recognized for its user-friendly interface and powerful statistical analysis capabilities. Here are a few reasons why Minitab is the go-to choice for creating control charts:
Step-by-Step Guide to Creating a Control Chart in Minitab
Step 1: Launch Minitab
Open Minitab on your computer. If you haven’t installed Minitab yet, you can download a trial version from the Minitab website.
Step 2: Enter Your Data
Input the data you want to analyze. You can either type the data directly into the Minitab worksheet or import it from an Excel file. Ensure that your data is organized correctly, typically in a single column for individual measurements or multiple columns for subgroup data.
Step 3: Select the Control Chart Type
Minitab offers various types of control charts, including:
To select a control chart, navigate to Stat > Control Charts in Minitab’s menu. Choose the appropriate chart based on your data type.
Step 4: Configure Your Control Chart
After selecting the control chart, a dialog box will appear. Here, you need to configure various settings:
Step 5: Interpret the Control Chart
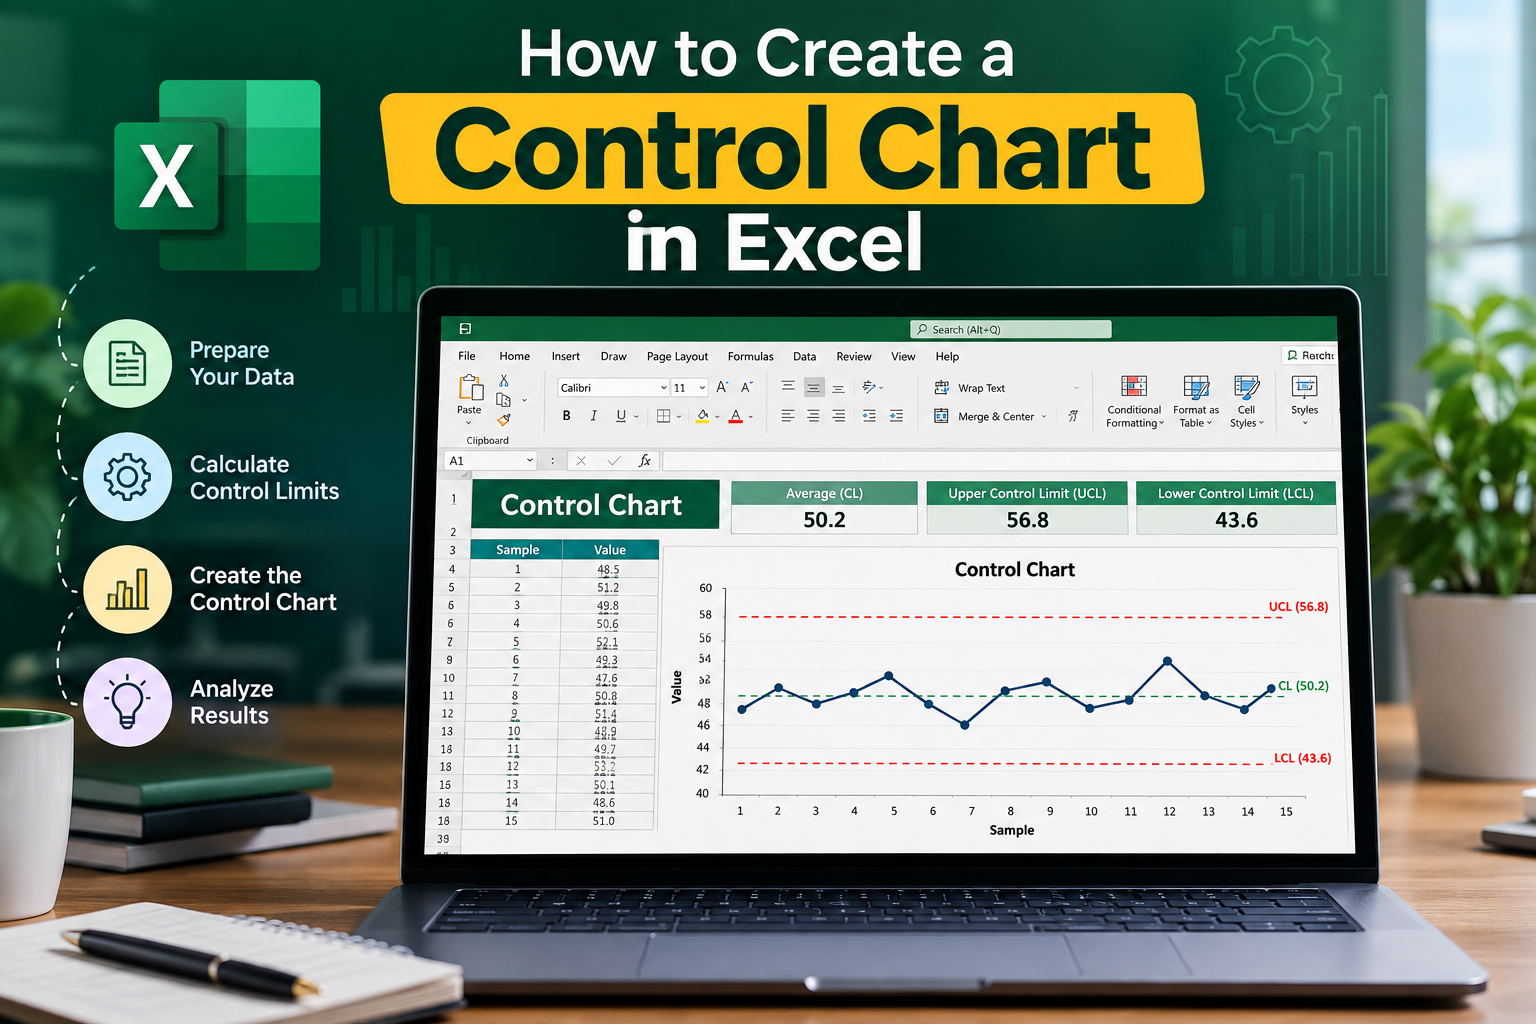
Once you have configured your control chart, click OK to generate it. Minitab will display the control chart in a separate window. Here are a few key components to look for:
Analyze the chart to determine if the process is stable. Look for patterns such as trends, shifts, or any points outside the control limits, which may indicate special cause variations.
Step 6: Save and Share Your Control Chart
After analyzing the control chart, it’s important to save your work. Minitab allows you to export your chart in various formats, including JPG, PNG, and PDF. This is especially useful for sharing insights with your team or including the chart in reports.
Best Practices for Using Control Charts in Minitab
To get the most out of your control charts in Minitab, consider the following best practices:
FAQs about Control Charts in Minitab
1. What types of control charts can I create in Minitab?
Minitab allows you to create various control charts, including I-MR charts, p-charts, np-charts, c-charts, and u-charts, each suited for different types of data.
2. How do I determine which control chart to use?
Your choice of control chart depends on the type of data you have. Use I-MR charts for individual measurements, p-charts for proportions, and c-charts for count data with a constant opportunity.
3. Can I customize my control chart in Minitab?
Yes, Minitab offers customization options for control charts, allowing you to adjust limits, labels, and overall appearance to meet your specific needs.
4. How often should I review my control charts?
Regularly reviewing control charts is crucial. Depending on your process, this could mean daily, weekly, or monthly evaluations to ensure ongoing stability.
5. Is it necessary to have statistical knowledge to use Minitab?
While a basic understanding of statistics can help, Minitab is designed to be user-friendly, and many resources are available for beginners to learn as they go.
Conclusion
Creating a control chart in Minitab is a straightforward process that can greatly enhance your quality control efforts. By following the steps outlined in this guide, you can effectively monitor and improve your processes, ensuring higher quality standards in your organization. Remember, the key to successful quality control lies not just in creating these charts but also in interpreting and acting on the insights they provide.
If you are ready to take your quality control processes to the next level, start using Minitab today! For more information and resources, visit the official Minitab website or check out their tutorials tailored for Indian audiences.
Call to Action: Have you tried creating a control chart in Minitab? Share your experiences in the comments below or reach out for more tips on quality control and statistical analysis!