
Latest Post








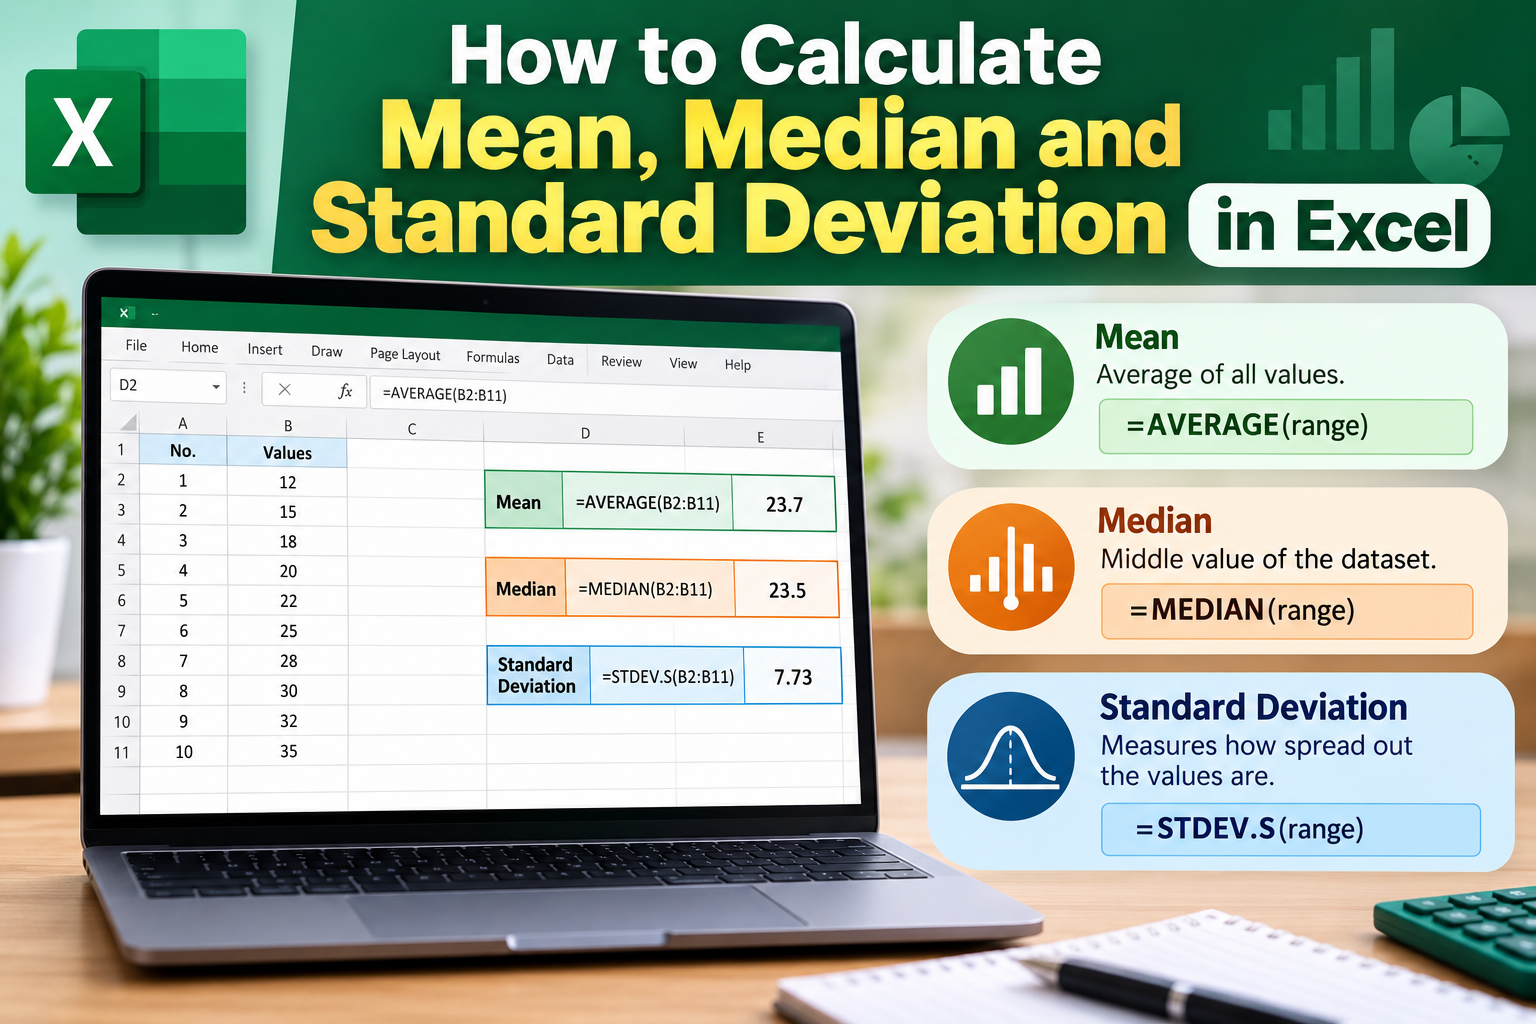

In today's data-driven world, understanding how to analyze data effectively is crucial, especially for professionals and students in India. Excel is one of the most widely used tools for data analysis, and knowing how to calculate mean, median, and standard deviation in Excel can significantly enhance your analytical skills. In this blog, we will explore each of these statistical measures in detail and provide you with step-by-step instructions on how to calculate them in Excel.
What are Mean, Median, and Standard Deviation?
Before diving into Excel, let’s define what mean, median, and standard deviation are:
Mean
The mean, often referred to as the average, is calculated by adding all the numbers in a dataset and dividing the sum by the count of numbers. It provides a general idea of the central tendency of the data.
Median
The median is the middle value of a dataset when it is ordered from least to greatest. If there is an even number of observations, the median is the average of the two middle numbers. This measure is particularly useful for understanding the distribution of data, especially when there are outliers.
Standard Deviation
Standard deviation is a statistic that measures the dispersion or spread of a set of values. A low standard deviation indicates that the values tend to be close to the mean, while a high standard deviation indicates that the values are spread out over a larger range. This measure is essential for understanding the variability in your data.
How to Calculate Mean, Median, and Standard Deviation in Excel
Now that we understand what these terms mean, let’s learn how to calculate them in Excel using simple formulas.
Calculating Mean in Excel
To calculate the mean in Excel, you can use the AVERAGE function. Here’s how:
Calculating Median in Excel
To calculate the median in Excel, you can use the MEDIAN function. Here’s how:
Calculating Standard Deviation in Excel
To calculate standard deviation in Excel, you can use the STDEV.P function for population standard deviation or STDEV.S for sample standard deviation. Here’s how:
Practical Example
Let’s consider a practical example to solidify our understanding:
Suppose you have the following dataset representing the marks obtained by students in a test:
To calculate the mean, median, and standard deviation in Excel:
Once you press Enter, Excel will provide you with the mean, median, and standard deviation of the marks, making it easier to analyze the performance of the students.
Common Mistakes to Avoid
While calculating mean, median, and standard deviation in Excel, it’s important to avoid common mistakes:
FAQs
1. What is the difference between mean and median?
The mean is the average value calculated by adding all numbers and dividing by the count, while the median is the middle value when the numbers are sorted in order.
2. Why is standard deviation important?
Standard deviation is important because it provides insight into the variability or spread of the data, helping to understand how consistent the data points are relative to the mean.
3. Can I calculate these measures for non-numeric data?
No, mean, median, and standard deviation can only be calculated for numeric data.
4. How can I visualize mean, median, and standard deviation in Excel?
You can create charts such as box plots or graphs to visualize these statistics. Excel offers various charting options to help illustrate your data.
Conclusion
Calculating mean, median, and standard deviation in Excel is a fundamental skill that can significantly enhance your data analysis capabilities. Whether you are a student, a business professional, or someone looking to understand data better, mastering these calculations will help you make informed decisions based on data insights. So, start practicing today!
Call to Action
If you found this guide helpful, please share it with your friends and colleagues who might benefit from learning how to calculate mean, median, and standard deviation in Excel. For more tips and tricks on Excel and data analysis, subscribe to our newsletter!