
Latest Post

Quality Management Courses



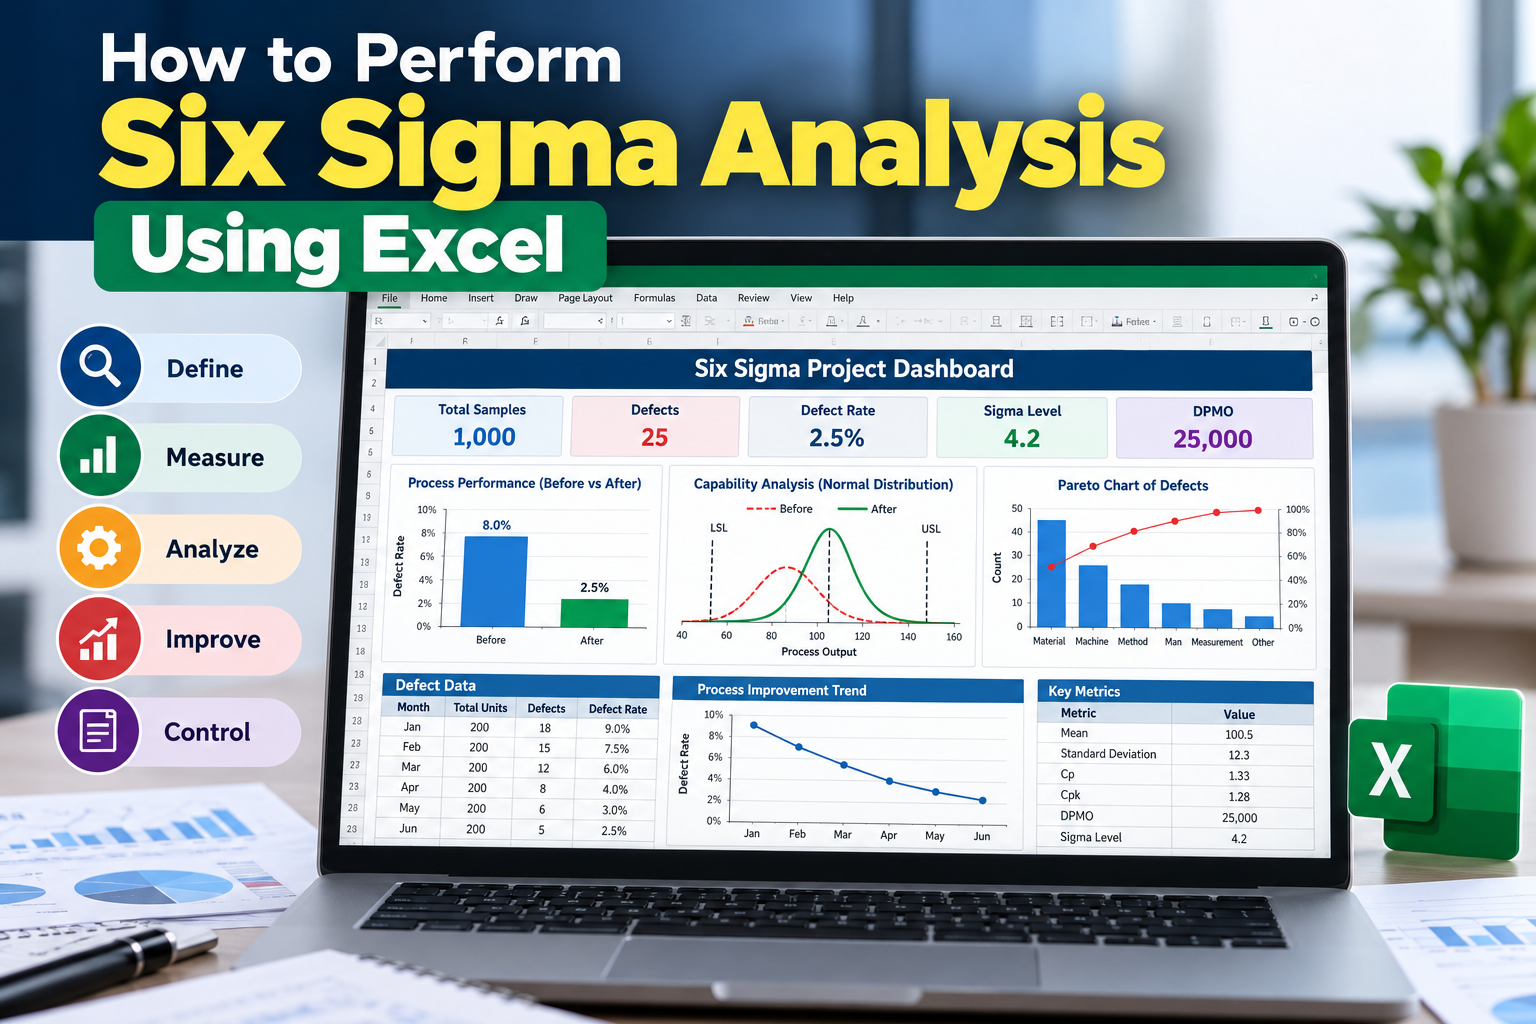

Six Sigma is a powerful methodology that helps organizations improve their processes by identifying and eliminating defects. It has gained immense popularity in various industries in India, from manufacturing to service sectors. In this blog, we will explore how to perform Six Sigma analysis using Excel, making it accessible for everyone, regardless of their technical expertise.
Understanding Six Sigma
Before diving into the practical aspects, let’s briefly understand what Six Sigma is. Six Sigma is a data-driven approach that seeks to improve quality by identifying and removing causes of defects and minimizing variability in manufacturing and business processes. The goal is to achieve a level of quality that produces no more than 3.4 defects per million opportunities.
The Importance of Six Sigma Analysis
Six Sigma analysis is crucial for businesses aiming for operational excellence. It helps in:
By performing Six Sigma analysis, companies in India can stay competitive in the global market and deliver high-quality products and services.
Getting Started with Six Sigma Analysis in Excel
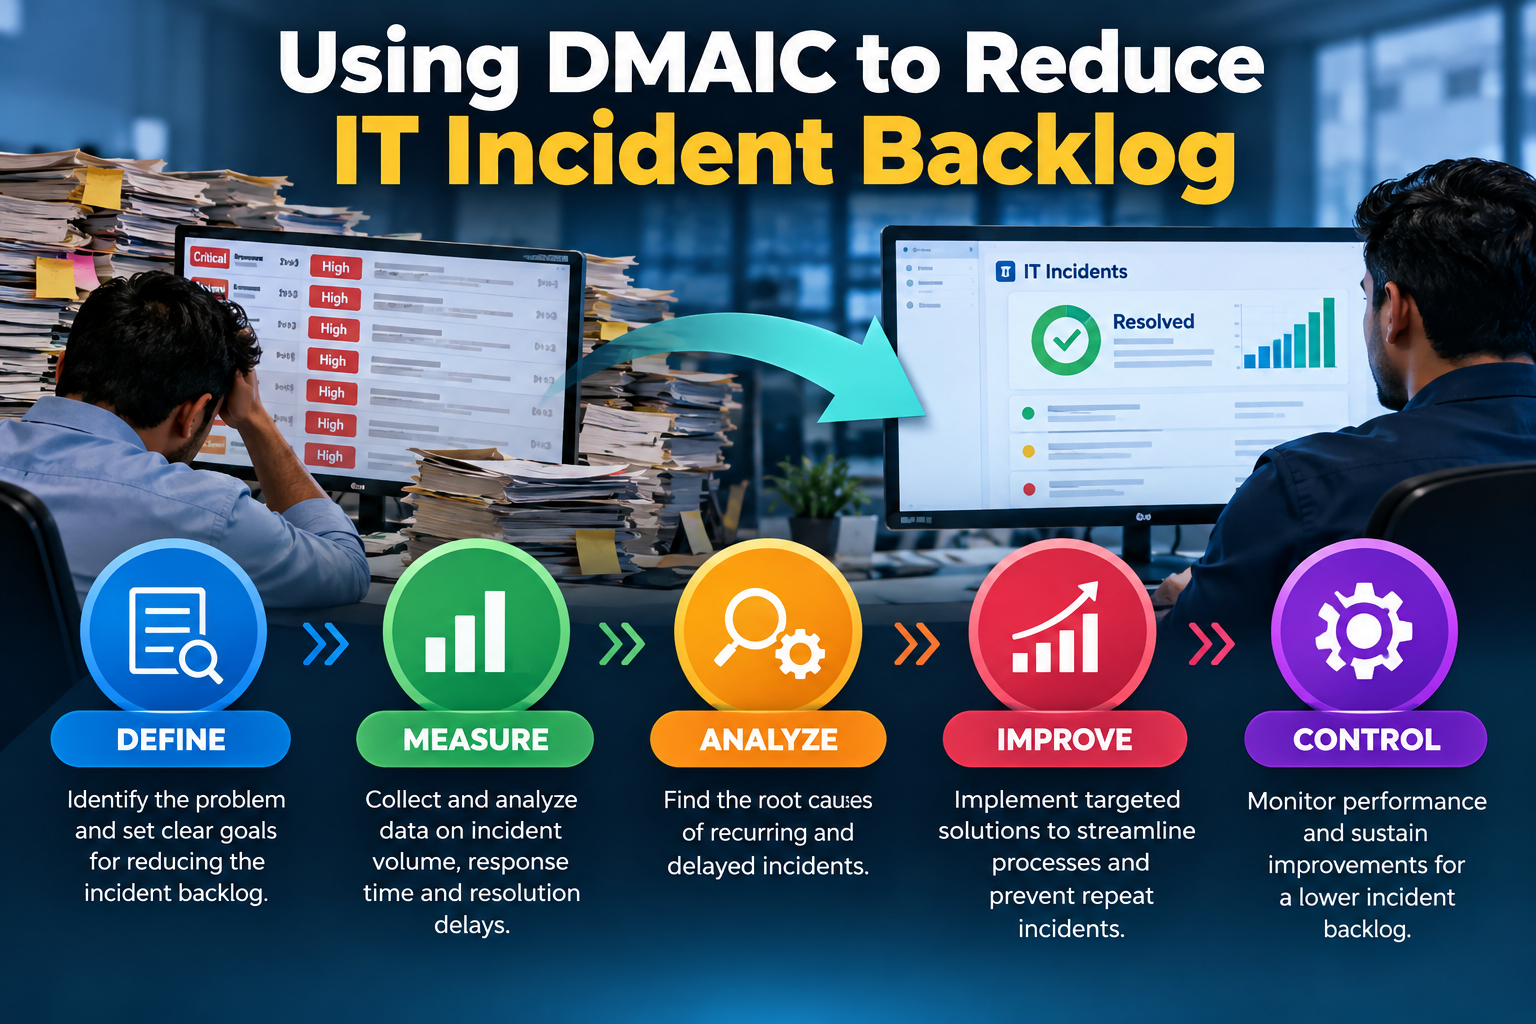
Excel is a versatile tool that simplifies Six Sigma analysis. It allows users to organize data, perform calculations, and visualize results efficiently. Here's how to perform Six Sigma analysis using Excel step by step.
Step 1: Define the Problem
The first step in Six Sigma is to clearly define the problem. Identify the process that needs improvement and outline the specific issues affecting performance. For example, if you're facing delays in order processing, note down the key metrics that indicate the problem.
Step 2: Measure the Current Process
Collect data on the current process using tools like surveys, feedback forms, or historical data. This data will serve as the basis for your analysis. In Excel, create a spreadsheet and input the collected data. Make sure to include relevant metrics such as cycle time, defect rates, and customer complaints.
Step 3: Analyze the Data
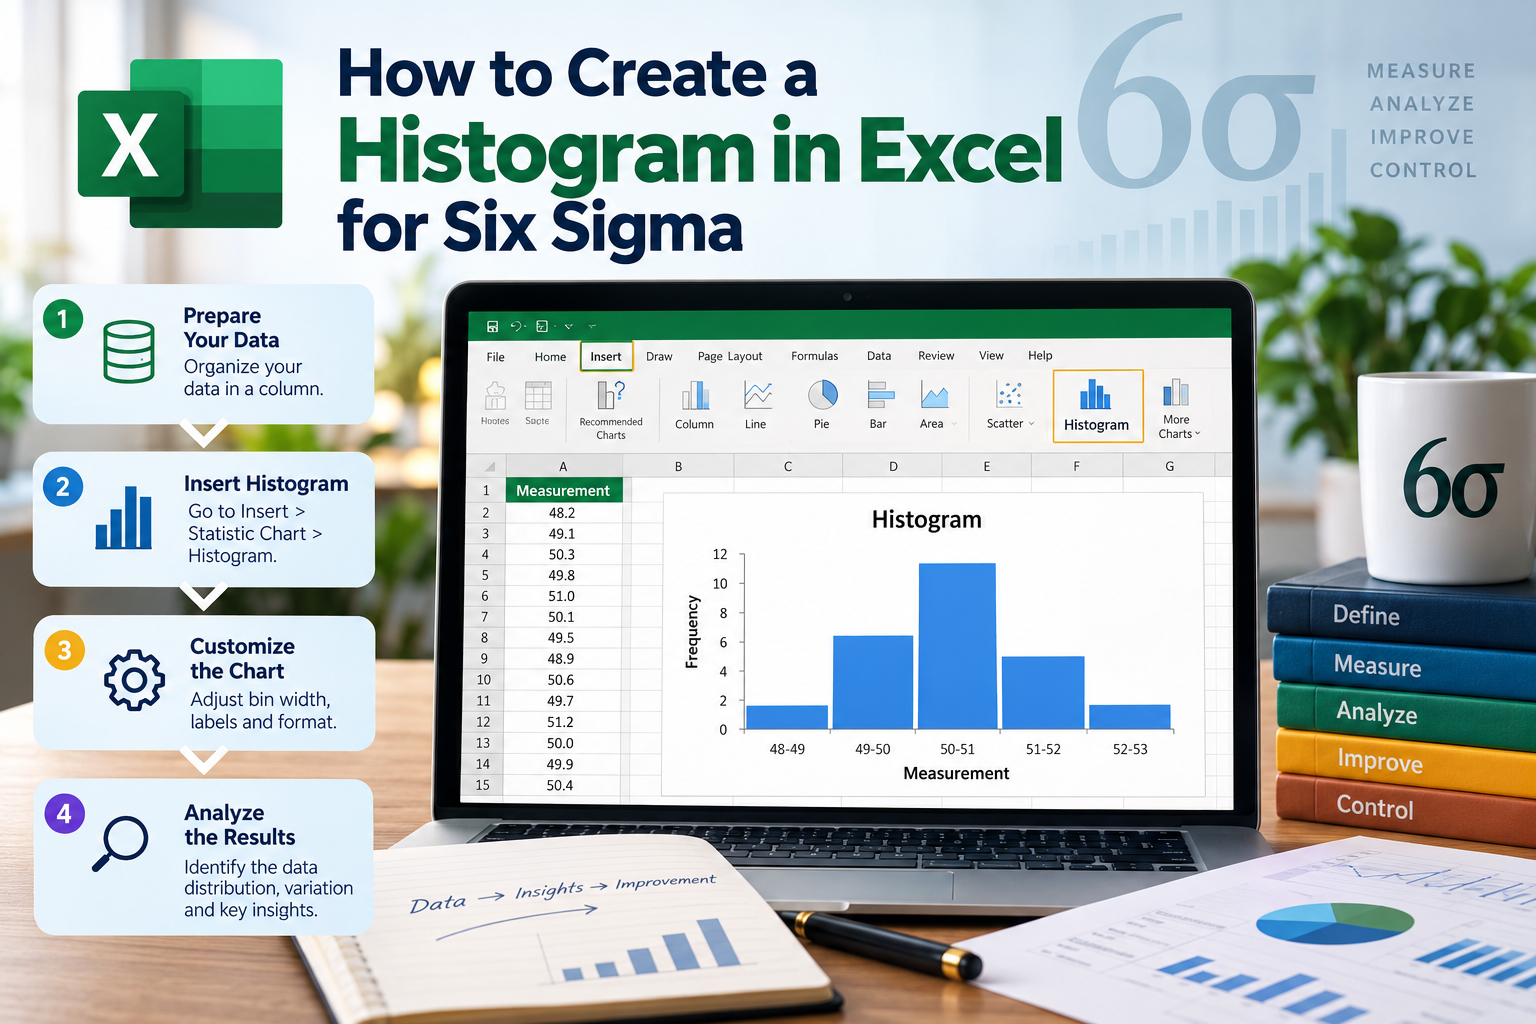
After gathering your data, it's time to analyze it. Use Excel functions and tools to perform the analysis:
Step 4: Identify Root Causes
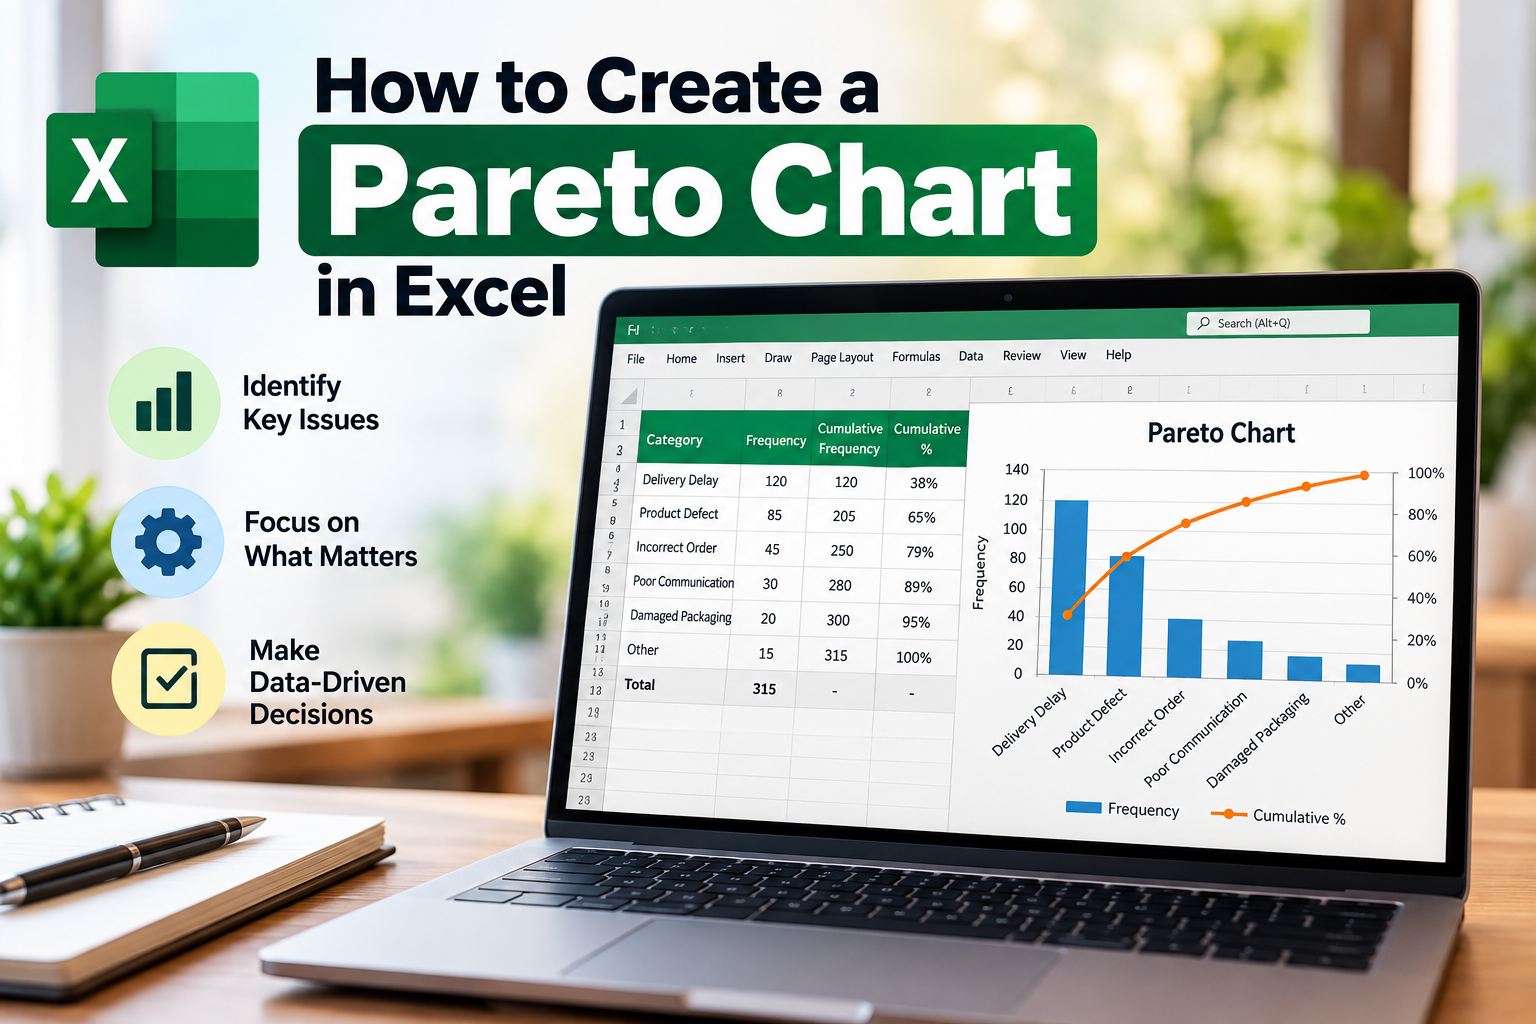
Once you have analyzed the data, identify the root causes of the problems. Techniques like the Fishbone diagram or Pareto analysis can be useful. In Excel, you can create a simple table to list potential causes and their impact on the process. This will help you prioritize which areas to focus on for improvement.
Step 5: Improve the Process
Based on your analysis, develop and implement solutions to address the identified root causes. Use Excel to create action plans, timelines, and responsibility matrices. This ensures that everyone involved knows their roles in the improvement process.
Step 6: Control the Improved Process
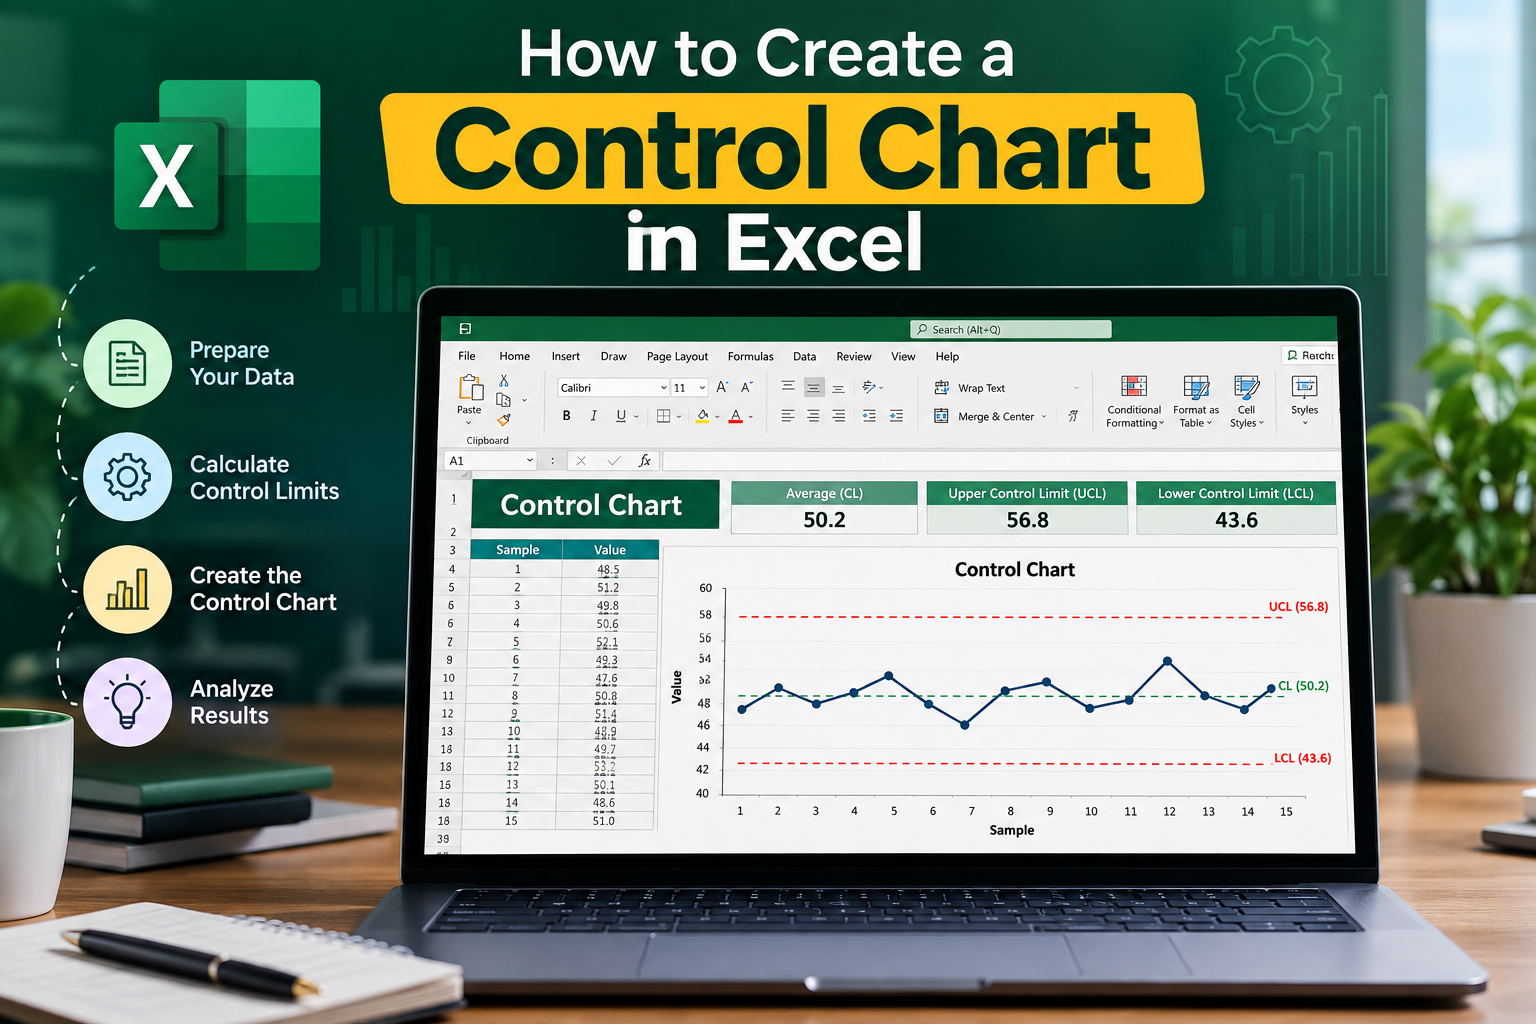
After implementing changes, it's crucial to monitor the new process to ensure that improvements are sustained. Use control charts and dashboards in Excel to track key metrics over time. Set up regular reviews to assess performance and make further adjustments as needed.
Advanced Excel Techniques for Six Sigma Analysis
For those who want to delve deeper into Six Sigma analysis using Excel, consider using the following advanced techniques:
1. Statistical Tools Add-ins
Excel has various add-ins that enhance its statistical capabilities. The Analysis ToolPak provides tools for regression analysis, ANOVA, and more. Enable it by going to File > Options > Add-ins and selecting Analysis ToolPak.
2. Solver Function
The Solver add-in can help optimize your processes by finding the best solution under given constraints. This is particularly useful for resource allocation problems.
3. VBA for Automation
If you have repetitive tasks, consider using VBA (Visual Basic for Applications) to automate them. This can save time and reduce errors in your Six Sigma analysis.
Best Practices for Performing Six Sigma Analysis in Excel
To maximize the effectiveness of your Six Sigma analysis using Excel, keep these best practices in mind:
FAQs
What is Six Sigma analysis?
Six Sigma analysis is a data-driven approach to improve quality by identifying and eliminating defects in processes. It employs various statistical tools and methodologies to achieve operational excellence.
Can I perform Six Sigma analysis without advanced statistical knowledge?
Yes! You can perform Six Sigma analysis using Excel's built-in functions and tools. While advanced statistical knowledge can enhance your analysis, basic understanding and Excel proficiency are sufficient for most tasks.
Is Excel the best tool for Six Sigma analysis?
Excel is a widely accessible and versatile tool for Six Sigma analysis, especially for small to medium-sized businesses. However, for large-scale data analysis, software like Minitab may be more appropriate.
Conclusion
Performing Six Sigma analysis using Excel is an effective way to enhance process quality and efficiency. By following the steps outlined above, you can identify areas for improvement, implement effective solutions, and sustain high-quality processes. Remember, the key to successful Six Sigma implementation lies in continuous monitoring and improvement.
Ready to take your process improvement to the next level? Download our free Six Sigma toolkit today and start your journey towards operational excellence! For more insights and resources on Six Sigma, subscribe to our newsletter.