
Latest Post





Quality Management Courses



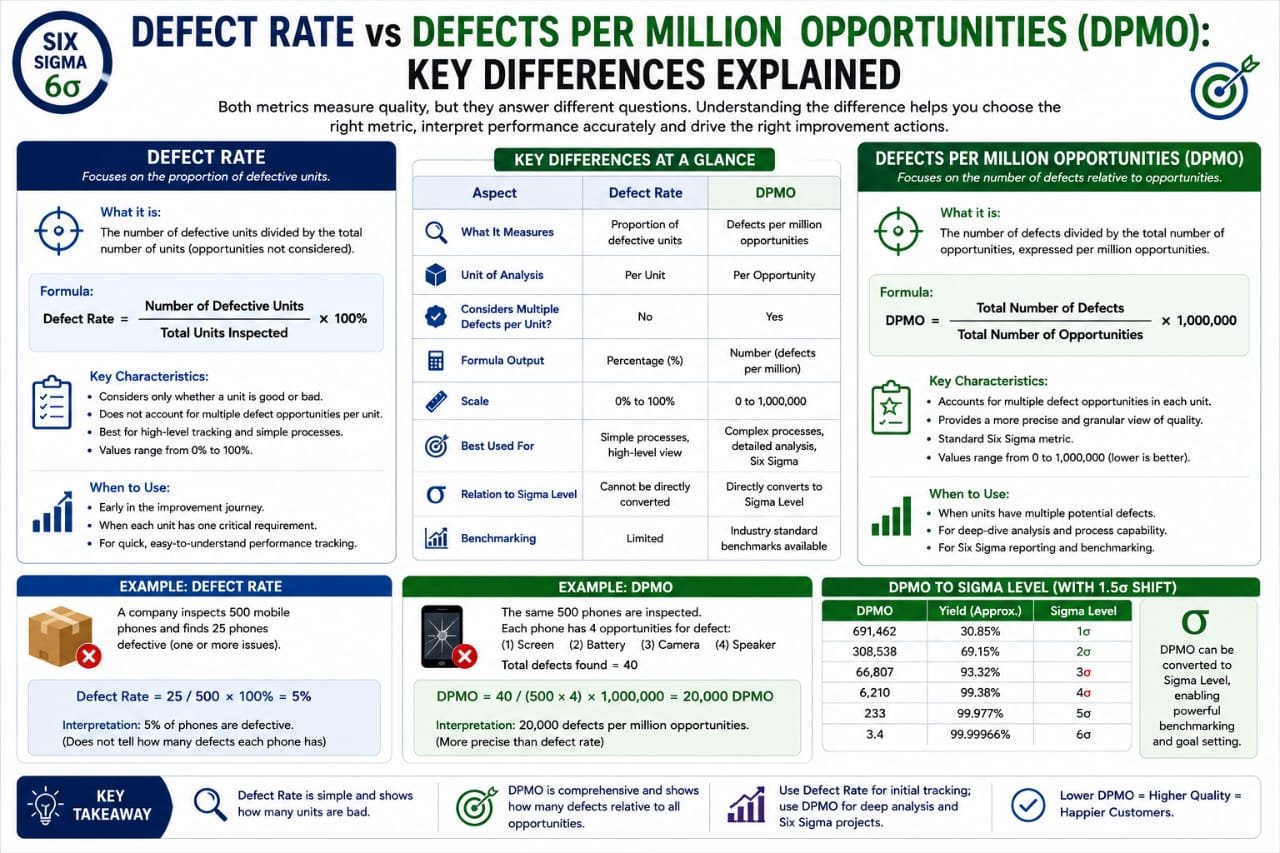

In the realm of quality management, understanding the nuances of defect measurement is crucial for businesses aiming to enhance their processes and products. Two pivotal metrics in this context are the defect rate and defects per million opportunities (DPMO). While both are essential for evaluating quality, they serve different purposes and offer unique insights. In this blog, we’ll delve into the key differences between defect rate and DPMO, how to calculate DPMO, and their implications in the Six Sigma framework.
What is Defect Rate?
The defect rate is a straightforward metric that quantifies the percentage of defective items in a batch or production process. It is calculated by dividing the number of defective items by the total number of items produced, then multiplying by 100. For example, if a company produces 1,000 units and finds 50 defective units, the defect rate would be:
Defect Rate = (Number of Defective Units / Total Units Produced) x 100
In this case, the defect rate would be 5%. This metric is particularly useful for organizations that want to assess the immediate quality of their output and identify areas needing improvement. However, it does not consider the opportunities for defects, which is where DPMO comes into play.
Understanding Defects Per Million Opportunities (DPMO)
Defects per million opportunities (DPMO) is a more nuanced metric that measures the number of defects relative to the number of opportunities for defects to occur. This metric is particularly valuable in complex processes where multiple chances for defects exist. The formula for calculating DPMO is:
DPMO = (Number of Defects / (Number of Opportunities)) x 1,000,000
Let’s say a manufacturing process has 1,000 units produced, and each unit has 3 opportunities for defects (such as scratches, functionality, and size). If there are 30 defects identified, the DPMO would be calculated as follows:
Opportunities = 1,000 units x 3 opportunities = 3,000
DPMO = (30 / 3,000) x 1,000,000 = 10,000
Thus, the DPMO of this process is 10,000. This metric provides a clearer picture of quality by factoring in the complexity of the production process and the total number of opportunities for defects.
Key Differences Between Defect Rate and DPMO
1. Measurement Focus
The primary difference between defect rate and DPMO lies in their focus. The defect rate simply measures the ratio of defective items to total produced items, while DPMO considers the total number of opportunities for defects, making it a more comprehensive metric.
2. Applicability
Defect rate is most useful in straightforward production processes with a clear definition of what constitutes a defect. In contrast, DPMO is essential in complex environments where multiple defect opportunities exist, such as in manufacturing and service industries.
3. Interpretation
A defect rate provides a percentage that is easy to understand but may not give the full story regarding quality. Conversely, DPMO offers a more granular perspective, which can help organizations identify specific areas for improvement in processes that have numerous potential failure points.
4. Impact on Quality Initiatives
In Six Sigma initiatives, DPMO is often preferred because it aligns with the methodology’s emphasis on reducing variation and improving process capability. Understanding DPMO can help organizations set more precise goals for quality improvement and better assess the effectiveness of their initiatives.
DPMO Calculation in Practical Scenarios
Calculating DPMO can vary depending on the context, but the fundamental principles remain the same. Here’s a breakdown of how to approach DPMO calculation in different scenarios:
1. Manufacturing
In manufacturing, define the number of units produced and the number of defects identified. Determine the number of opportunities by considering each unit's potential defects. Apply the DPMO formula to derive meaningful insights into production quality.
2. Service Industries
For service-based industries, the opportunities for defects might include customer interactions, service delivery points, or transaction processes. Track the number of defects in service delivery and calculate the DPMO to evaluate service quality.
3. Software Development
In software development, defects can be bugs or issues that arise during the coding phase. Each feature may have multiple opportunities for defects based on user requirements. Calculating DPMO can help software teams identify areas to enhance code quality.
Importance of DPMO in Six Sigma
Six Sigma is a data-driven approach aimed at improving quality by removing the causes of defects and minimizing variability in processes. DPMO plays a critical role in this methodology for several reasons:
1. Quantifiable Goals
Setting DPMO targets allows organizations to establish clear, quantifiable quality goals that can be tracked over time. This helps in measuring the effectiveness of quality improvement initiatives.
2. Focus on Improvement
By analyzing DPMO, organizations can pinpoint specific areas where defects occur, allowing them to target improvement efforts more effectively.
3. Industry Standard
DPMO is widely recognized across various industries, making it a standard metric for comparing quality performance against competitors or industry benchmarks.
FAQs
What is the ideal DPMO for a manufacturing process?
The ideal DPMO depends on the industry and specific quality standards. In general, a DPMO of less than 3.4 is considered world-class, indicating a high level of quality.
How can I reduce my organization's DPMO?
To reduce DPMO, focus on process improvement techniques such as root cause analysis, employee training, and implementing quality control measures. Utilizing Six Sigma methodologies can also significantly aid in reducing DPMO.
Is a lower defect rate always better?
While a lower defect rate is preferable, it’s essential to consider the context. An organization with a low defect rate but high complexity in production may have a higher DPMO than a simpler process with a higher defect rate. Both metrics should be evaluated together for a comprehensive quality assessment.
Conclusion
Understanding the differences between defect rate and defects per million opportunities (DPMO) is vital for any organization striving for excellence in quality management. While both metrics provide valuable insights, DPMO offers a more detailed view by considering the opportunities for defects, making it an essential tool in the Six Sigma toolbox. By measuring and improving DPMO, businesses can enhance their processes, reduce variability, and ultimately deliver higher quality products and services to their customers.
If you’re looking to enhance your organization’s quality management practices, consider implementing DPMO calculations and Six Sigma methodologies to drive continuous improvement. For expert assistance and tailored solutions, contact us today!