
Latest Post





Quality Management Courses



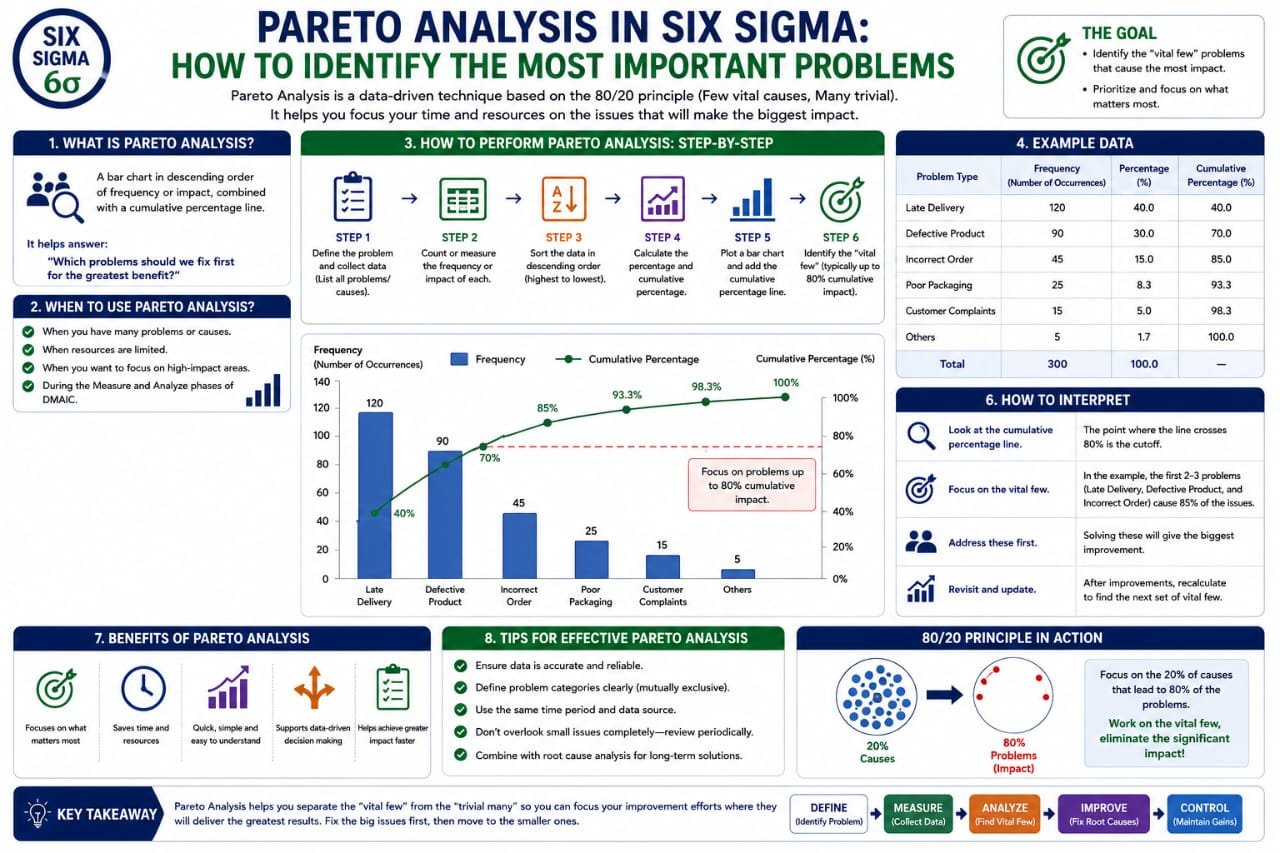

In the world of quality management, understanding the root causes of problems is essential for effective decision-making. One of the most powerful tools at your disposal is the Pareto analysis in Six Sigma. This method not only helps in identifying the most critical issues, but it also provides a structured approach to prioritizing solutions. In this comprehensive guide, we'll delve into the Pareto principle in quality, explore how to create a Pareto chart, and discuss practical Pareto chart examples relevant to the Indian context.
The Pareto Principle: An Overview
The 80/20 rule Six Sigma is often referred to as the Pareto principle, named after the Italian economist Vilfredo Pareto. He observed that 80% of effects come from 20% of causes. In quality management, this principle suggests that a small number of problems are responsible for the majority of defects. By focusing on these key issues, organizations can achieve substantial improvements in quality and efficiency.
Why Use Pareto Analysis in Six Sigma?
Pareto analysis is instrumental in Six Sigma for several reasons:
Creating a Pareto Chart
Creating a Pareto chart is the first step in conducting a Pareto analysis. Here’s a step-by-step guide to help you get started:
Step 1: Identify the Problem Areas
Begin by collecting data on quality problems. This could include defects, customer complaints, or any issues affecting your product or service quality. For example, in the Indian manufacturing sector, you might track defects in production lines or customer feedback on product quality.
Step 2: Categorize the Problems
Sort the identified problems into categories. This could be based on the type of defect, the department responsible, or any other relevant criteria. For instance, if you’re analyzing a textile factory, categories could include fabric defects, stitching errors, and dye issues.
Step 3: Quantify the Problems
Assign a numerical value to each category. This could be the number of occurrences, cost impact, or customer complaints. For instance, if fabric defects account for 50 complaints, stitching errors account for 20, and dye issues for 10, you’d have a clear quantitative basis for your analysis.
Step 4: Create the Pareto Chart
Using the data collected, create a bar chart where the x-axis represents the categories of problems and the y-axis represents the frequency or impact of each issue. The bars should be arranged in descending order from left to right. You can also add a cumulative percentage line to illustrate the cumulative impact of the problems.
Step 5: Analyze the Chart
Once your chart is complete, analyze it to identify the "vital few" problems that contribute to the majority of your quality issues. This will guide your improvement efforts effectively.
Pareto Chart Examples in the Indian Context
Let’s explore some practical Pareto chart examples relevant to various sectors in India:
Example 1: Manufacturing Sector
A manufacturing plant may notice that out of 1000 defects reported, 800 are due to poor machinery calibration, 150 due to human error, and 50 due to material quality. A Pareto chart will clearly show that machine calibration is the primary issue, allowing management to focus on that area for improvement.
Example 2: Healthcare Sector
In a hospital, patient complaints might be categorized into long waiting times, inadequate staff, and poor service quality. After analyzing the data, it could be revealed that 70% of complaints stem from long waiting times. This insight will prompt the hospital to streamline its processes to enhance patient experience.
Example 3: Service Industry
For a restaurant, customer feedback might indicate issues with food quality, service speed, and cleanliness. A Pareto analysis may reveal that 60% of complaints relate to service speed, suggesting that investing in staff training could significantly improve overall customer satisfaction.
Implementing Solutions Based on Pareto Analysis
Once you’ve identified the critical issues, it’s time to implement targeted solutions. Here are some strategies to consider:
FAQs about Pareto Analysis in Six Sigma
What is Pareto Analysis?
Pareto Analysis is a statistical technique used to determine the most important factors in a dataset. It helps prioritize issues based on their impact, following the 80/20 rule.
How does Pareto Analysis apply to Six Sigma?
In Six Sigma, Pareto Analysis is used to identify the few critical issues that contribute to the majority of defects, enabling organizations to focus their improvement efforts where they will have the most significant impact.
Can you provide a simple example of a Pareto chart?
Sure! If a call center receives 100 complaints and 70 are related to long wait times, 20 to rude staff, and 10 to billing errors, a Pareto chart will show that wait times are the most significant issue, guiding management's focus.
Is Pareto Analysis applicable in all industries?
Yes, Pareto Analysis can be applied in various sectors, including manufacturing, healthcare, service, and more, making it a versatile tool for quality problem analysis.
Conclusion
In conclusion, Pareto analysis in Six Sigma is an invaluable method for organizations aiming to enhance their quality management processes. By identifying the most significant problems using the Pareto principle in quality, you can focus your improvement efforts effectively. Whether you’re in manufacturing, healthcare, or any other sector, leveraging this analytical tool will lead to substantial gains in efficiency and customer satisfaction.
Are you ready to implement Pareto analysis in your organization? Start today and witness the transformation in your quality management processes!
Call to Action: If you found this article helpful, share it with your colleagues and follow us for more insights on quality management and Six Sigma strategies!