
Latest Post



Quality Management Courses



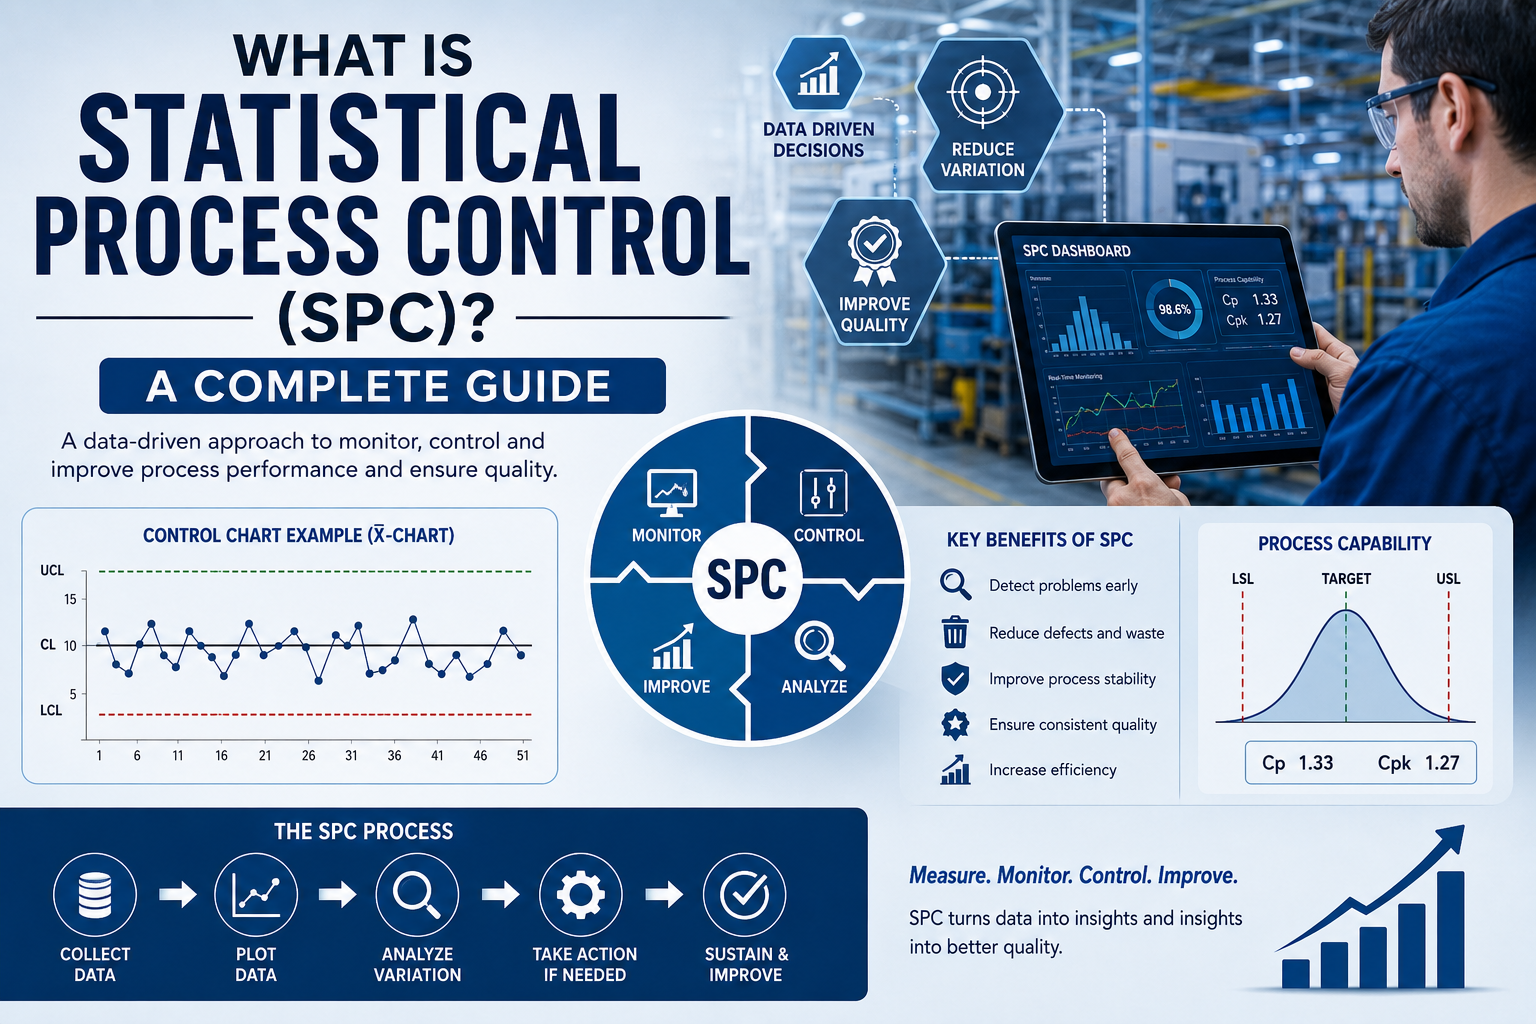

In the world of manufacturing, ensuring quality is not just a goal; it’s a necessity. One of the most effective methods to achieve this is through Statistical Process Control, commonly referred to as SPC. In this comprehensive guide, we’ll explore what SPC is, its significance in manufacturing quality control, and how it can help businesses improve their processes.
What is Statistical Process Control (SPC)?
Statistical Process Control (SPC) is a method used to monitor and control a process through the use of statistical techniques. By applying these techniques, organizations can ensure that their processes operate at their full potential, reducing waste and increasing efficiency. SPC is a fundamental part of quality control and is widely used in various industries, especially in manufacturing.
The Importance of SPC in Manufacturing
SPC plays a critical role in the manufacturing sector for several reasons:
How Does SPC Work?
SPC uses a variety of tools and techniques to monitor processes. Here are the key components involved:
1. Data Collection
Data is collected from various stages of the manufacturing process. This can include measurements of dimensions, temperatures, or other critical parameters that affect product quality.
2. Control Charts
One of the most important tools in SPC is the SPC chart, which visually represents data over time. Control charts help identify trends, shifts, or any unusual patterns in the data.
3. Process Capability Analysis
This analysis assesses how well a process meets specified limits or tolerances. It provides valuable insights into the capability of a manufacturing process to produce products that meet quality standards.
4. Continuous Improvement
SPC is not just about monitoring; it also promotes continuous improvement. By analyzing data, organizations can identify areas for improvement and implement necessary changes.
Types of SPC Charts
SPC charts are vital tools for monitoring processes. Here are some of the most commonly used types:
1. X-bar and R Chart
This chart is used for monitoring the mean and range of a process over time. It’s particularly useful for processes where measurements are taken in subgroups.
2. P Chart
The P chart is used for monitoring the proportion of defective items in a process. It helps organizations keep track of defect rates over time.
3. C Chart
This chart is used for count data, specifically monitoring the number of defects per unit over time. It’s ideal for processes where the number of defects can be counted.
Implementing SPC in Your Organization
Implementing SPC in a manufacturing environment requires careful planning and execution. Here are the steps to successfully integrate SPC:
1. Training and Awareness
Educate your team about SPC concepts and its benefits. Ensure that everyone understands the importance of data-driven decision-making.
2. Data Collection Systems
Set up systems to collect accurate and timely data. This could involve automated systems or manual data entry, depending on your manufacturing setup.
3. Choose the Right SPC Charts
Based on your process type and data, select the appropriate SPC charts that will provide meaningful insights.
4. Monitor and Analyze
Regularly monitor the SPC charts and analyze the data. Look for trends and variations that could indicate potential issues.
5. Continuous Improvement
Use the insights gained from SPC to make informed decisions and drive continuous improvement initiatives within your organization.
Challenges in SPC Implementation
While SPC offers numerous benefits, organizations may face challenges during implementation:
FAQs about Statistical Process Control (SPC)
1. What industries use SPC?
SPC is used in various industries, including manufacturing, healthcare, food production, and service industries, to ensure quality control and process improvement.
2. How often should SPC charts be reviewed?
SPC charts should be reviewed regularly, depending on the process and production rate. Daily or weekly reviews are common in high-volume manufacturing environments.
3. Can SPC be applied to non-manufacturing processes?
Yes, SPC can be applied to any process where variability exists, including service industries, healthcare, and administrative processes.
4. What is the difference between SPC and Six Sigma?
While both SPC and Six Sigma focus on quality improvement, SPC is primarily about monitoring processes, whereas Six Sigma is a comprehensive methodology that aims to reduce defects and improve overall quality.
Conclusion
Statistical Process Control is a powerful tool for organizations looking to enhance their manufacturing quality control. By implementing SPC, businesses can ensure consistent quality, reduce costs, and foster a culture of continuous improvement. If you are in the manufacturing sector and want to take your quality control processes to the next level, consider integrating SPC into your operations.
Call to Action
If you’re ready to improve your manufacturing processes through Statistical Process Control, contact us today for a consultation! Let’s work together to enhance your quality control systems and drive your business toward success.