
Latest Post
Quality Management Courses



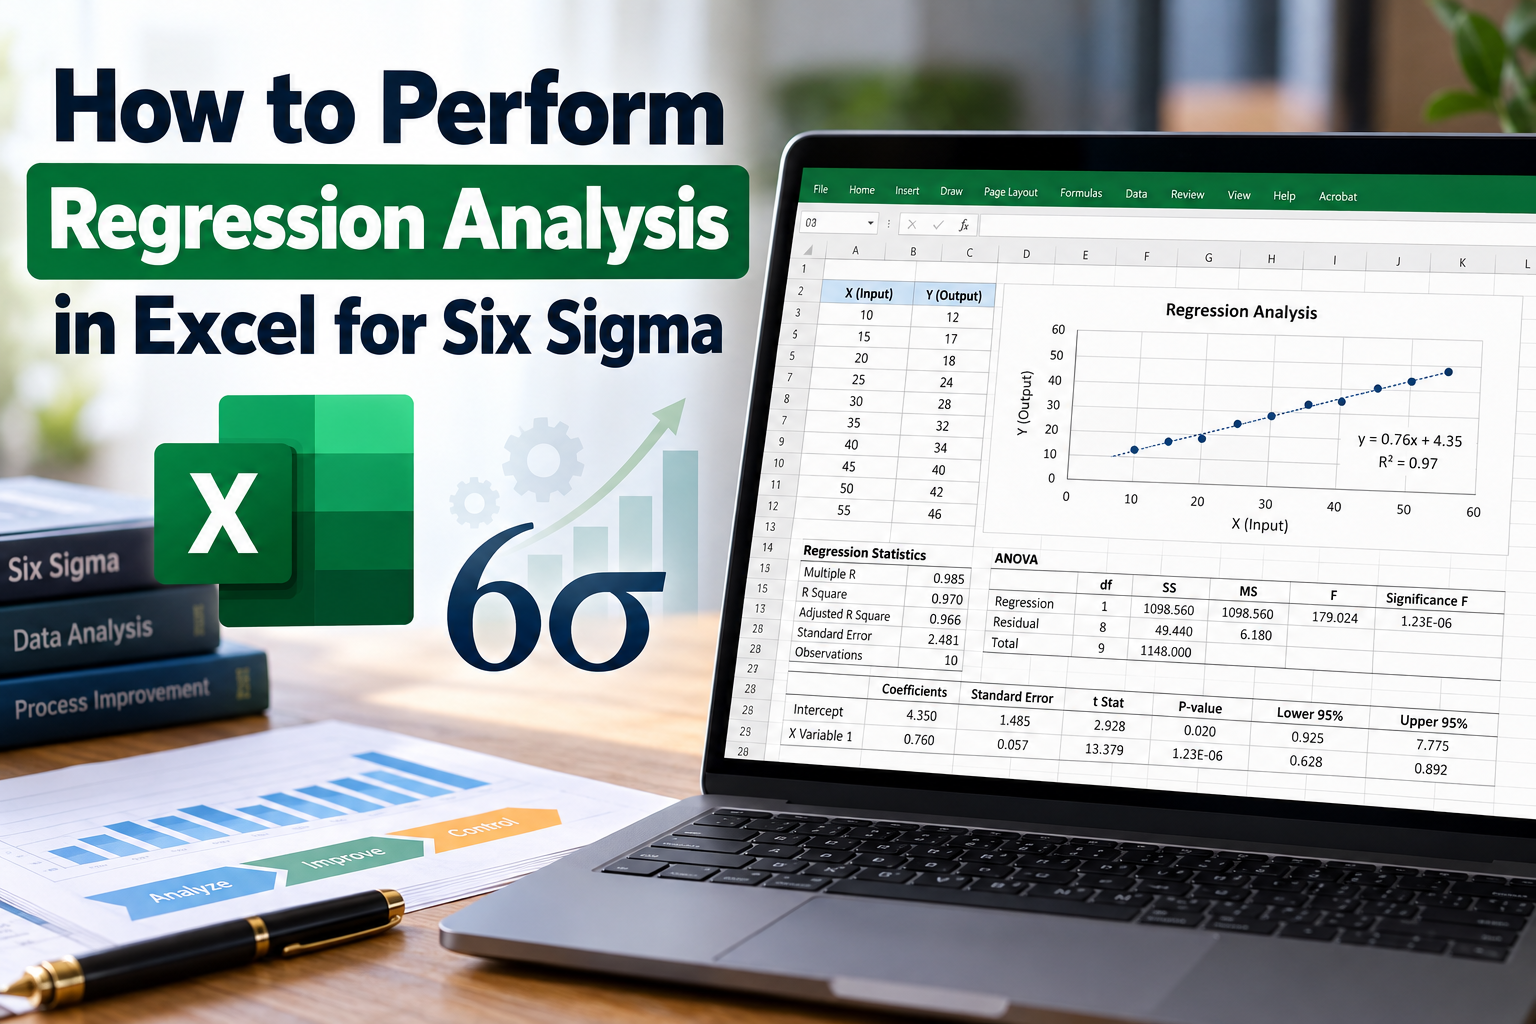

When it comes to data analysis in Six Sigma, regression analysis in Excel is a powerful tool that can help you uncover relationships among variables, predict outcomes, and enhance decision-making processes. This blog will guide you through the process of performing regression analysis in Excel, tailored for the Indian audience keen on applying Six Sigma methodologies in their organizations.
Understanding Regression Analysis
Before delving into the intricacies of performing regression analysis in Excel, it’s essential to grasp what regression analysis is. In simple terms, regression analysis is a statistical technique used to determine the relationship between a dependent variable and one or more independent variables. In the context of Six Sigma, it helps identify factors affecting quality and performance metrics.
Types of Regression Analysis
There are various types of regression analysis that you can perform, depending on your data and objectives:
Why Use Excel for Regression Analysis?
Excel is a widely used tool in India for data analysis due to its accessibility and user-friendly interface. Here are some reasons why you should consider using Excel for regression analysis:
Steps to Perform Regression Analysis in Excel
Now, let’s dive into the step-by-step process of performing regression analysis in Excel. For this guide, we'll focus on simple linear regression, which is the most straightforward method:
Step 1: Prepare Your Data
Before you can perform regression analysis, it’s crucial to prepare your data. This involves ensuring that your data is clean, organized, and free from errors. Here’s how you can prepare your data:
Step 2: Insert a Scatter Plot
Visualizing your data can help you understand the relationship between the variables better. To create a scatter plot:
The scatter plot will show how your independent variable correlates with the dependent variable.
Step 3: Add a Trendline
To perform regression analysis, you need to add a trendline to your scatter plot:
Step 4: Interpret the Results
Once you have added the trendline, you will see an equation in the form of Y = mX + b on your chart, where:
The R-squared value indicates how well the independent variable explains the variability of the dependent variable. A value closer to 1 suggests a strong correlation, while a value close to 0 indicates a weak correlation.
Step 5: Use Excel Functions for Detailed Analysis
For more detailed regression analysis, you can use Excel's built-in functions:
Practical Applications of Regression Analysis in Six Sigma
Regression analysis is beneficial in various Six Sigma projects. Here are some practical applications:
Common Challenges and Solutions
While performing regression analysis in Excel, you may encounter several challenges:
FAQs
1. What is the difference between simple and multiple regression analysis?
Simple regression involves one independent variable predicting a dependent variable, while multiple regression involves two or more independent variables.
2. Can I perform regression analysis in Excel without any prior experience?
Yes, Excel is designed to be user-friendly, and with the steps outlined in this blog, even beginners can perform regression analysis effectively.
3. How can I improve the accuracy of my regression model?
Ensure your data is clean, consider relevant variables, and visualize your data to understand relationships before performing regression analysis.
Conclusion
Mastering regression analysis in Excel is a valuable skill for anyone involved in Six Sigma projects. By understanding the relationships between variables, you can make informed decisions that drive quality and efficiency in your processes. Whether you are a beginner or looking to enhance your skills, following the steps outlined in this guide will empower you to leverage Excel for meaningful data analysis.
If you found this guide helpful, don’t hesitate to share it with your colleagues and fellow Six Sigma practitioners. For more insights and tips on data analysis, subscribe to our newsletter or check out our other blogs!